Alaina Holland

View My LinkedIn Profile
Check Me Out on Medium
Or send me an email: alainaholland27@gmail.com
Book Bans in the United States
Project Overview
This project, part of the WuMSDS Data Visualization Course final project, focuses on storytelling through the lens of book bans in the United States. We explore the impact these bans have on K-12 schools and the broader implications for education and society.
Authors
- Alaina Holland
- Jordyn Irwin
Date Presented
- December 5, 2023
Data Source
Project Context
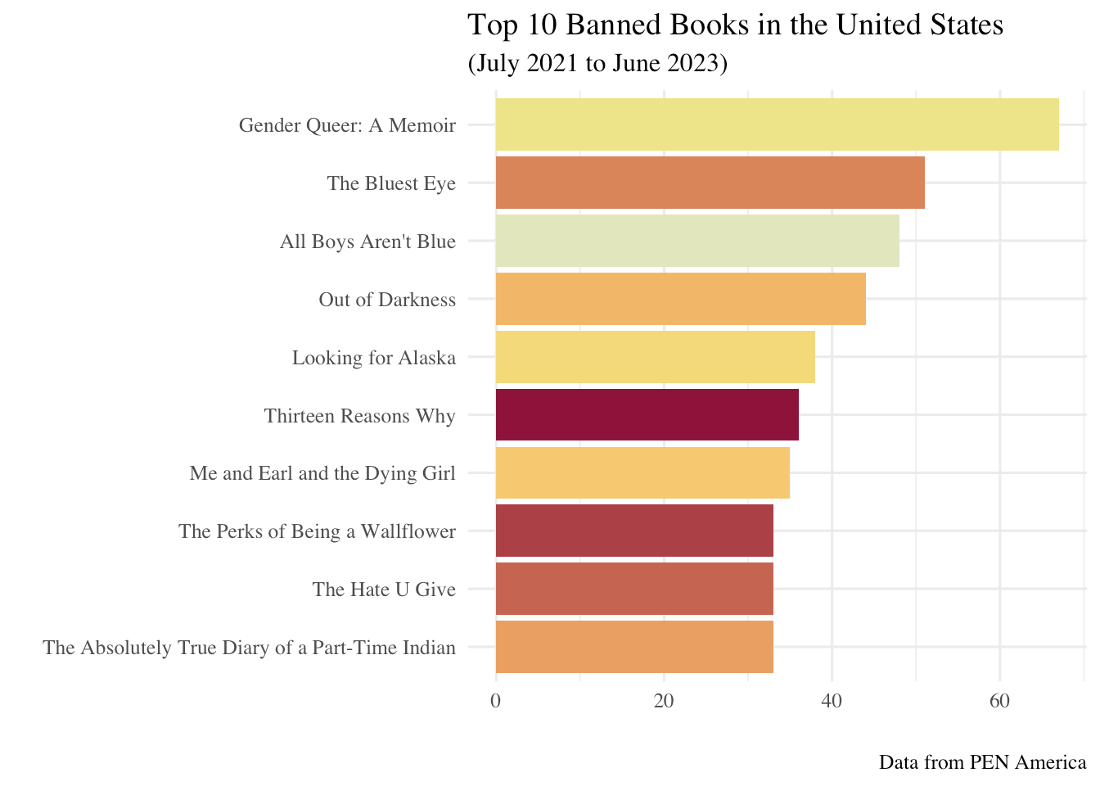
Imagine you are part of the American Library Association. Over the past two years, there have been 5,894 books banned in K-12 schools across the United States. This project aims to highlight the importance of these bans and why they matter.
Why Should You Care if a Book Gets Banned?
Books provide:
- Access to Diversity in Education
- Encouragement of Critical Thinking through Exposure
- Promotion of Equal Access
- Safeguarding of Freedom of Expression
- Development of Cultural Understanding
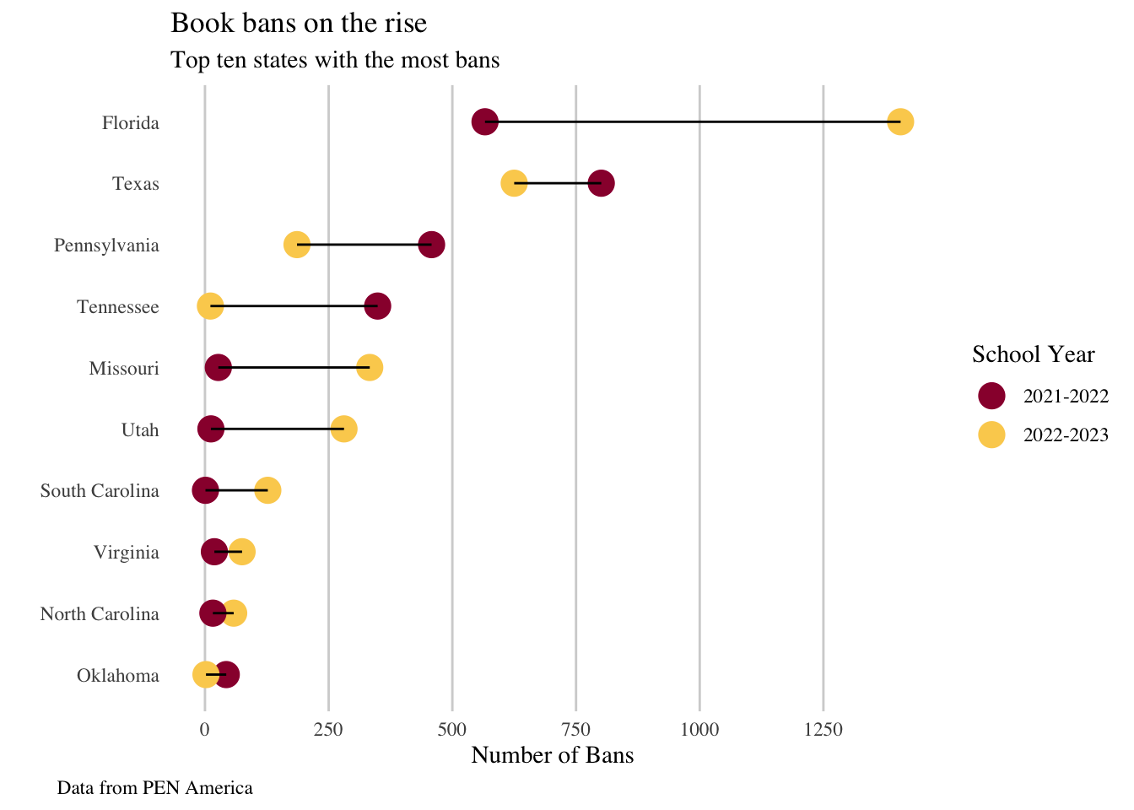
In the 2022-2023 academic year, Texas and Florida led in the number of book bans, with Texas banning at least 500 books and Florida banning over 750 books.

Themes in Banned Books
Banned books often cover themes such as:
- Identity
- Coming-of-Age
- Social Issues
- Acceptance and Belonging
- Friendship and Relationships

Project Outcome
The primary outcome of this project was to create a polished graphic that effectively tells a story about book bans in the United States. Our goal was to visually communicate the data and its implications in a compelling and accessible manner.
Explore our interactive graphic on Plotly to visualize the data on book bans.

Presentation
You can view the full presentation here.
Questions?
If you have any questions or need further information, please feel free to reach out.
Additional Information
For more details and to explore the data further, please visit:
Data Description
The data for this project is sourced from PEN America’s Index of School Book Bans. It includes:
- Title
- Author
- School District
- State
Data Links
The data covers the period from July 1, 2021, to June 30, 2023, and highlights restrictions on student access to books in US school libraries or classrooms. Some bans have been lifted, while others are ongoing.
This portfolio piece provides an overview of our project on book bans in the United States, highlighting the importance of books in education and the impact of restricting access. We hope this project sheds light on the significance of preserving freedom of expression and access to diverse literary resources.